
No watches or warnings in effect for Mont-Royal, QC.
|
METRIC |
IMPERIAL
|
Updated: 06/24/2026 @ 03:30 EDT (0 sec ago) | |||||||||||||||||||||||||||||||||||||||||||||||||||||||||||||||||||
| Temperature | Current Conditions | Forecast / Storm Prediction | ||||||||||||||||||||||||||||||||||||||||||||||||||||||||||||||||||
|
|
|
||||||||||||||||||||||||||||||||||||||||||||||||||||||||||||||||||
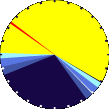
| Dew Point | Liquid Precipitation | Wind Speed | Sun/Moon | |||||||||||||||||||||||||||||||||||||||||||||||||||||||||||||||||
|
|
|
|
|||||||||||||||||||||||||||||||||||||||||||||||||||||||||||||||||
| Humidity | Barometer | |||||||||||||||||||||||||||||||||||||||||||||||||||||||||||||||||||
|
|
|||||||||||||||||||||||||||||||||||||||||||||||||||||||||||||||||||
| Heating Degree Days | Coming Soon | Wind Chill | ||||||||||||||||||||||||||||||||||||||||||||||||||||||||||||||||||
|
|
|
||||||||||||||||||||||||||||||||||||||||||||||||||||||||||||||||||
| UV Summary/Forecast | Solar Summary | |||||||||||||||||||||||||||||||||||||||||||||||||||||||||||||||||||
|
|
|||||||||||||||||||||||||||||||||||||||||||||||||||||||||||||||||||
| Almanac | Irrigation Index5 | Station All Time Records | Cloud Level | |||||||||||||||||||||||||||||||||||||||||||||||||||||||||||||||||
|
|
|
|
|||||||||||||||||||||||||||||||||||||||||||||||||||||||||||||||||


| 1 Rain season: Jan 1st to Dec 31st. 2 Snow season July 1st to June 30th. 3 Snow manually measured usually around 7AM and 7PM. 5 Estimated amount of water needed to replace the water used by plants and evaporation from the past week. (Negative numbers mean amount of water needed, positive numbers mean excess water is present). 10 Historical average only to day 24 of just the month of June for this station since 2018. 11 Historical average rain this season to day 24 of June for this station since 2018. |
| EC Weather Forecast - Outlook Tonight & Wed, 24 Jun | ||||||||||||||
|
||||||||||||||
|
||||||||||||||
|
||||||||||||||
|
ajax-dashboard6.php - Version 6.95h - 20-Feb-2023 - Script by: Scott of BurnsvilleWeatherLIVE.com Now supported by Saratoga-weather.org Download |
||||||||||||||
